December 16, 2024
A Simple Guide to Using Order Blocks
Order blocks are a key concept in understanding how smart money operates in the market. In essence, an order block is a specific price range where large institutional players, often referred to as “smart money,” have placed significant orders. These blocks can act as magnets for price, either drawing it towards them or propelling it away. Understanding how to identify and use order blocks can provide a powerful edge in trading by giving insights into potential turning points and areas of high probability trades. In this post, we’ll unpack this concept, showing you how to spot order blocks and how they relate to liquidity voids and price gaps, so you can incorporate them into your own trading strategy.
What are Order Blocks?

Defining order blocks as areas of institutional interest.
Order blocks are essentially specific price zones on a chart where large financial institutions, like banks, hedge funds, and other “smart money” players, have placed significant orders. These aren’t just any areas of price action; they’re locations where these large participants have previously shown a strong interest in buying or selling. Think of them as footprints or “signatures” left behind by these influential market movers. These areas are important because their large order sizes create an imbalance in the market, often resulting in noticeable price movements when revisited. Identifying them gives us a peek into where the big players are likely to be active again.
Explaining the concept of “smart money” and their order placement.
“Smart money” refers to these large institutional traders who have the capital and resources to significantly influence market direction. Unlike retail traders, who typically trade smaller volumes, “smart money” needs to accumulate or distribute positions in a strategic manner. They cannot simply enter a large order all at once without causing considerable price slippage. Therefore, they often work their orders into the market in layers, using limit orders, and they do this within specific price ranges. When these large orders are triggered or interacted with by price again, they can cause displacement, signaling a change in price delivery. These institutional orders are the reason we see those significant moves away from consolidation areas, which then form order blocks. According to the ICT core content, these large players may scale their positions over time, “utilizing hedging” at levels of interest.
Key Characteristics of Order Blocks
Identifying order blocks through price action (consolidation, displacement).
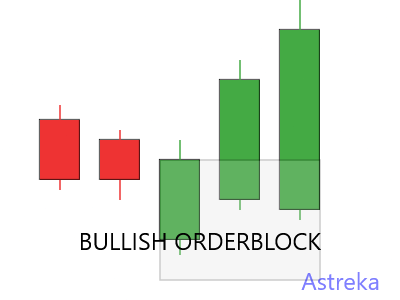
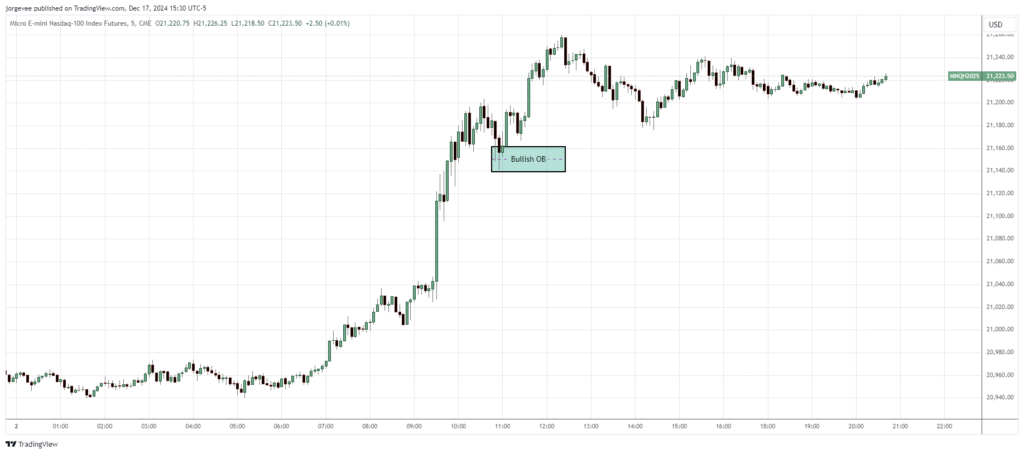
Order blocks often form after a period of price consolidation, where the market is in a state of equilibrium, with price moving within a range. However, when “smart money” starts to accumulate or distribute their positions, you’ll notice a significant “displacement,” or a sharp and decisive move away from this consolidation. For bullish order blocks, it’s typically the last down candle or price bar before the aggressive move up; conversely, for bearish order blocks, it’s the last up candle before the aggressive move down (as described in the provided text). Look for candles with wide bodies or ranges, which demonstrate that buying or selling pressure. This is the “change” in price delivery as described in the ICT content. The key is to look for areas of price imbalance immediately before a significant directional move.
Understanding the role of liquidity voids and imbalances.
Order blocks are closely related to liquidity voids and price imbalances. When price displaces away from consolidation, it creates a “void of contrarian liquidity”, which is a gap or range that is lacking buyers on the move down, or sellers on the move up. These liquidity voids are often found within the range of the order block itself. The imbalance arises from the rapid and one-sided price movement caused by the large orders, resulting in few counter orders being filled. This leaves behind an area with a lack of trading activity, which price will then often seek to revisit, or fill at a later time. According to ICT core content, “Price typically will want to revisit this range or void of contrarian liquidity.” This is why understanding order blocks can also help anticipate potential retracements or reversals when price returns to these previously unfulfilled areas, creating a strategic trading opportunity.
Identifying and Using Order Blocks in Practice
Spotting Order Blocks on Charts
Using different timeframes to identify order blocks (e.g., 1-minute, 5-minute, 15-minute).
Looking for the “last down candle before the up move” or “last up candle before the down move”.

Trading Strategies with Order Blocks
One effective approach to utilizing order blocks is to identify them based on candle formations. Traders are advised to look for candles with large bodies and small wicks, as these often indicate strong buying or selling pressure. In a way candles act like “neon lights” signaling key trading opportunities across various timeframes. By pinpointing these order blocks, traders can strategically set their entries and exits, enhancing their chances of success in both bullish and bearish market conditions.
Additionally, the integration of order blocks into a broader trading strategy can involve defining trade entries and exits based on market trends. For example, entering trades near bullish order blocks during uptrends and bearish order blocks during downtrends can optimize trade execution.
Trading strategies that leverage order blocks are increasingly recognized for their potential to enhance trading performance. By understanding how to identify these key price levels and incorporating them into a structured trading plan, traders can gain a significant edge in the market. As the trading landscape continues to evolve, the focus on order blocks is likely to remain a vital aspect of successful trading strategies.
Entering trades based on retests of order blocks
Entering Trades Based on Retests of Order Blocks
- Liquidity Void Revisit: The text emphasizes that price “typically will want to revisit this range or void of contrarian liquidity.” This implies that after price moves away from an order block, creating a liquidity void, a return to that order block area presents a trading opportunity. The idea is not to chase the initial move but to wait for a retest.
- Mitigation Blocks: The section on Mitigation Blocks (Img. 1.1) explicitly shows a scenario where price moves away from an area (“B”) and then returns to a reference point (“A”). The text notes this as “an opportunity to liquidate or mitigate the Net loss.” While focused on the institutional side, it illustrates that when price returns to a specific price area, in this case an order block, it creates an opportunity to enter a position.
- Reclaimed Blocks: The “Reclaimed Block” concept shows price moving away from a support, then reaching lower, and finally referencing the prior lows on the sell side of the curve. The text states that “we are going to reference the last down close candle(s) on the Sell-Side of the curve…This will later be seen as Bullish Reclaimed Orderblocks” and that “In the buy side of the curve these old blocks will be reclaimed longs.” This is implicitly saying a retest of that candle may be a buy opportunity.
- Gaps as Entry Points: The discussion on price gaps, specifically the common gap after a liquidity void has been closed (at 104.76), provides a practical example of using a retest. It says, “if we see a gap here we can put an order in here the sell with a limit order at 104.70” showing that a limit order in the area of a gap, which is related to order blocks and voids, can be used to enter trades on a retest.
These points collectively suggest that the core principle of trading order blocks involves waiting for a return to the block after an initial move and using it as a trading entry point.
Combining order blocks with other technical indicators for confirmation
While not necessary “technical indicators,” we certainly have other elements for confluence:
- Liquidity Pools: The section on liquidity pools discusses where buy and sell stops may be residing, and how those areas might be used to pair up orders, either for market makers or us as traders. This is an idea of using areas of stops to inform entries.
- Market Structure Shift (MSS): The “Breaker Block” concept describes a “retracement after the Market Structure Shift will provide buying opportunities.” This implies the use of market structure analysis to confirm potential order block trades.
- Time-based analysis: What time was the orderblock formed? and Reaction after orderblock formation. This implies a strong emphasis on observing when an order block forms within the context of daily sessions or macro time periods (like specific opening times, kill zones or news events). For example, noting that an order block formed at 10:50, may have a higher level of significance than one formed at a random time. Analyzing how the market reacts after the order block forms, such as during a specific session, kill zone or after a major news event, is also important for establishing confluence in your analysis. This approach suggests that timing or session context plays a crucial role in determining the validity and potential of an order block.
These concepts show that order blocks shouldn’t be used in isolation but rather alongside other market analysis tools.